

S&P 500 at a Tipping Point as Trump’s Trade War Strains Markets
The S&P 500 Index is approaching a significant technical turning point that poses a risk of a prolonged decline following President Donald Trump’s implementation of the highest American tariffs seen in a century.
The index’s decline of more than 3% at the opening places the American equities benchmark close to the correction level of roughly 5,500. If this level is maintained, there are few support levels beneath this psychological barrier to engage dip buyers, as per technical analysts who assess daily averages and other indicators to gauge market momentum.
ADVERTISEMENT
CONTINUE READING BELOW
Experts on Wall Street have been anticipating the “Trump put,” expecting the president to intervene to prevent substantial harm to the stock market. However, he has instigated this selloff. Consequently, traders are monitoring essential technical levels, as these can influence the timing of price movements when technical analyses and economic forecasts become less reliable.
“There is a sense of panic in the atmosphere,” remarked Jay Woods, chief global strategist at Freedom Capital Markets. “Trump and Bessent are attempting to promote this trade war to the American public, but the stock market isn’t receptive. People are weary of this narrative; they fail to see how tariffs will do anything but risk plunging the U.S. into a recession, leading them to withdraw their investments from the market.”
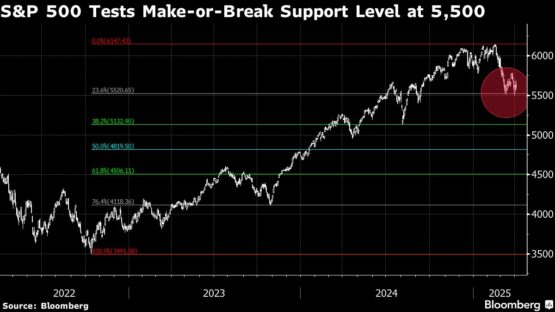
Should the S&P 500 fail to maintain its position near 5,500, it risks descending into the 4,900 to 5,300 range. This potential drop has strategists reevaluating their year-end projections. For instance, a decline of that magnitude would make RBC Capital Markets’s year-end bear scenario of 5,550 more plausible compared to its current price target of 6,200, as explained by Lori Calvasina, head of U.S. equity strategy at the firm.
During the previous trade war in 2018 and 2019, stock positioning fell to the lower end of its historical range. In current terms, the S&P 500 would have to drop to 5,250—a decrease of over 7% from Wednesday’s closing value of 5,670.97, according to Deutsche Bank AG data. Beyond this point, technical traders are also monitoring 5,119.26—the S&P’s low on August 5, which was influenced by the unwinding of the yen carry trade that unsettled markets.
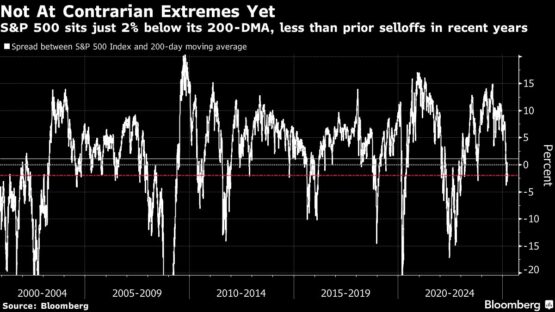
Another critical level to observe is the extent to which the S&P 500 dips below its 200-day moving average, which hovers around 5,762, according to Woods. The index recently broke a streak of 336 days above this threshold and closed 2% below it on Wednesday. In past selloffs in 2018, 2020, and 2022, it dropped more than 10% beneath this support line.
ADVERTISEMENT:
CONTINUE READING BELOW
Mark Newton, head of technical strategy at Fundstrat Global Advisors, indicates that the 5,400 level, reflecting the S&P 500’s lows from early September, is vital. He is also tracking support levels between 5,375 and 5,425, based on significant Fibonacci levels established from the bear-market lows in 2022. Technical analysts observe these Fibonacci retracement levels to identify potential reversal points of stock prices.
“The rapidity of the decline will undoubtedly leave lasting scars,” stated John Kolovos, head of technical strategy at Macro Risk Advisors. “Trump’s serious tone—unwavering, almost—signals that these tariffs are unlikely to ease post-negotiation anytime soon. April 2 marked a ‘culmination’ of a long-standing goal regarding tariffs.”
© 2025 Bloomberg
Follow Moneyweb’s dedicated finance and business news on WhatsApp here.