

Can Solana Bulls Maintain $90 Support with Bearish Crossover on the Horizon?
On Wednesday, Solana’s price experienced a pullback as bullish momentum weakened near a significant Fibonacci resistance level. Traders were also keeping an eye out for potential signs of a bearish MACD crossover on the daily chart.
Summary
- Solana’s price retreated toward the $90 support zone after facing resistance in the $94–$98 Fibonacci area.
- The MACD indicator is nearing a bearish crossover on the daily chart, indicating a decline in bullish momentum following SOL’s recent surge.
- Analysts are monitoring if bulls can hold the $90 support level to avert a deeper decline towards the $87 and $85 thresholds.
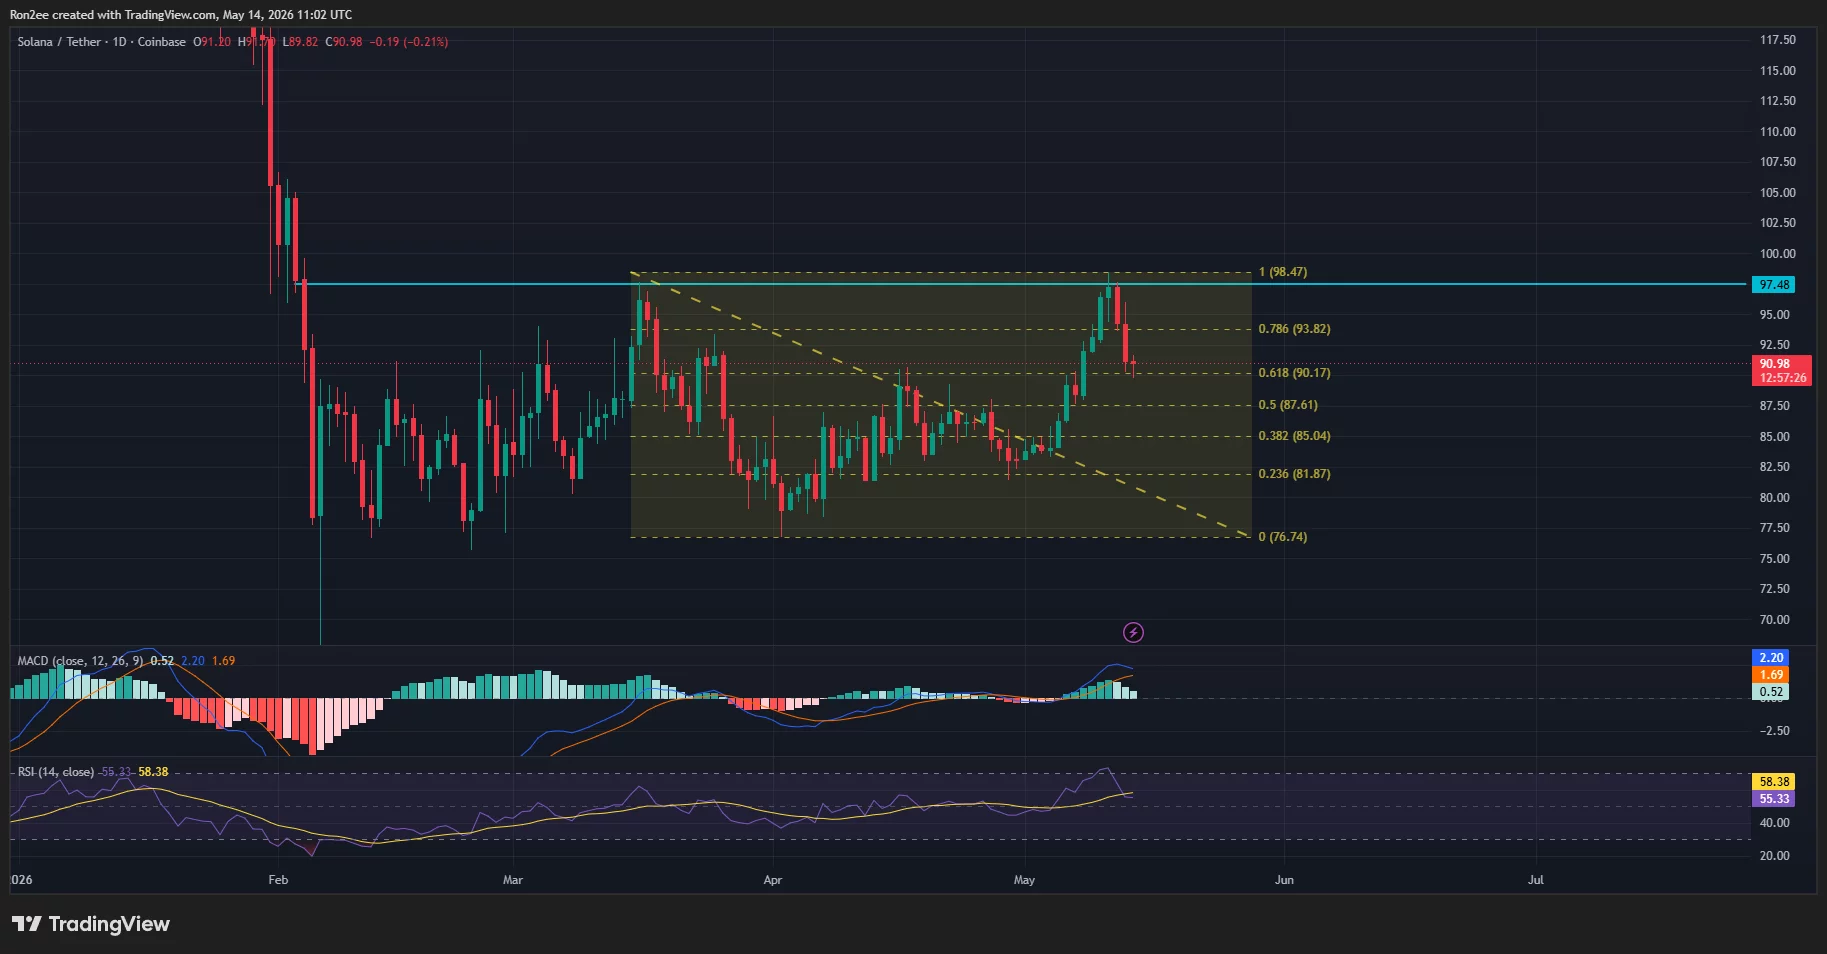
As reported by crypto.news, Solana (SOL) was trading around $91 as of May 14, declining from the week’s peak of about $97.5. Although the token has shown significant gains from its April lows near $76, the latest price movements indicate a potential cooling of bullish momentum after a strong rally over several weeks.
The rebound in Solana’s price over recent weeks was mainly fueled by a positive shift in sentiment in the broader crypto market, along with rising optimism about the upcoming Alpenglow upgrade and Firedancer validator developments. Increased activity in Solana-based decentralized finance protocols and memecoin trading also contributed to demand for the token.
Simultaneously, derivatives sentiment improved significantly during the recent rally, with SOL futures open interest increasing alongside positive funding rates, reflecting bullish positions from leveraged traders.
However, the latest retreat occurred after SOL encountered resistance near a crucial Fibonacci zone between the 0.786 retracement at $93.82 and the recent swing high of about $98.47.
On the daily chart, Solana is still trading above the critical 0.618 Fibonacci retracement support located at around $90.17, which is now a key short-term support level that bulls need to defend to avoid a more significant correction.
Despite the recent setbacks, the overall structure remains somewhat bullish as SOL continues to form higher lows since April, maintaining a position well above the major support zone between $76 and $82, where buyers had previously entered aggressively during earlier sell-offs.
Nevertheless, momentum indicators suggest that bullish strength may be waning. The MACD histogram has begun to decline after a strong expansion phase earlier this month, with the MACD line itself nearing a bearish crossover with the signal line. This crossover tends to indicate a slowdown in bullish momentum and can lead to short-term corrections if selling pressure intensifies.
Additionally, the Relative Strength Index has started to retreat from the near-overbought region and is currently situated within the neutral 55–58 range, indicating that while bullish momentum is fading, it has not yet reversed completely.
If Solana fails to hold the critical $90 support level, sellers might target the next significant support areas near $87.6 and $85, which also correspond with essential Fibonacci retracement levels and prior consolidation zones.
On the upside, bulls would likely need to reclaim the $94–$96 resistance zone to negate the short-term bearish outlook and restore momentum towards the psychological $100 level. A successful breakout above $100 could pave the way for a rise towards the $103 and $106 resistance areas in the near term.
For the time being, traders are concentrating on whether Solana can stabilize above the crucial $90 support level while monitoring momentum indicators that are signaling potential warnings of a trend slowdown.
Disclosure: This article does not constitute investment advice. The content and materials presented on this page are solely for educational purposes.