

Bitcoin Cash Falls Below $400: Are 2025 Lows on the Horizon?
This week, Bitcoin Cash experienced a significant drop in price after breaching the crucial psychological support level of $400. This decline has sparked worries that the cryptocurrency might revisit its 2025 lows if the bearish trend continues to accelerate.
Summary
- The price of Bitcoin Cash has fallen more than 11% below the key $400 support level, reaching its lowest point since early March.
- Bearish momentum has intensified following a MACD bearish crossover, while the RSI has dropped to near 21, indicating severe oversold conditions.
- Analysts are now identifying the $320–$340 range as the next significant downside target if BCH is unable to reclaim the lost $400 support zone.
Data from crypto.news indicates that Bitcoin Cash (BCH) saw a decline of over 11%, trading around $359 as of May 18. This marks one of its most substantial single-day drops in recent months, pushing BCH to its lowest level since early March as sellers regained dominance in the market.
This correction comes amid a renewed slump across the wider altcoin market as investors pulled back from riskier assets following Bitcoin’s recent rejection at local highs.
Despite intermittent price increases tied to Bitcoin rallies and renewed speculative interest in legacy proof-of-work cryptocurrencies, Bitcoin Cash has struggled to maintain bullish momentum over the past several months.
Often considered a high-beta proxy for Bitcoin due to their shared origins and similar payment narratives, BCH has significantly lagged behind BTC in the latest market cycle.
Market sentiment surrounding Bitcoin Cash has declined as trading activity and capital flows increasingly shift toward newer blockchain ecosystems and assets focused on institutional investment.
Additionally, derivatives sentiment has worsened as bearish positioning accelerated following the recent breakdown below support.
On the daily chart, Bitcoin Cash has decisively fallen below the important $400 support zone that had served as a major support level for the past several months.
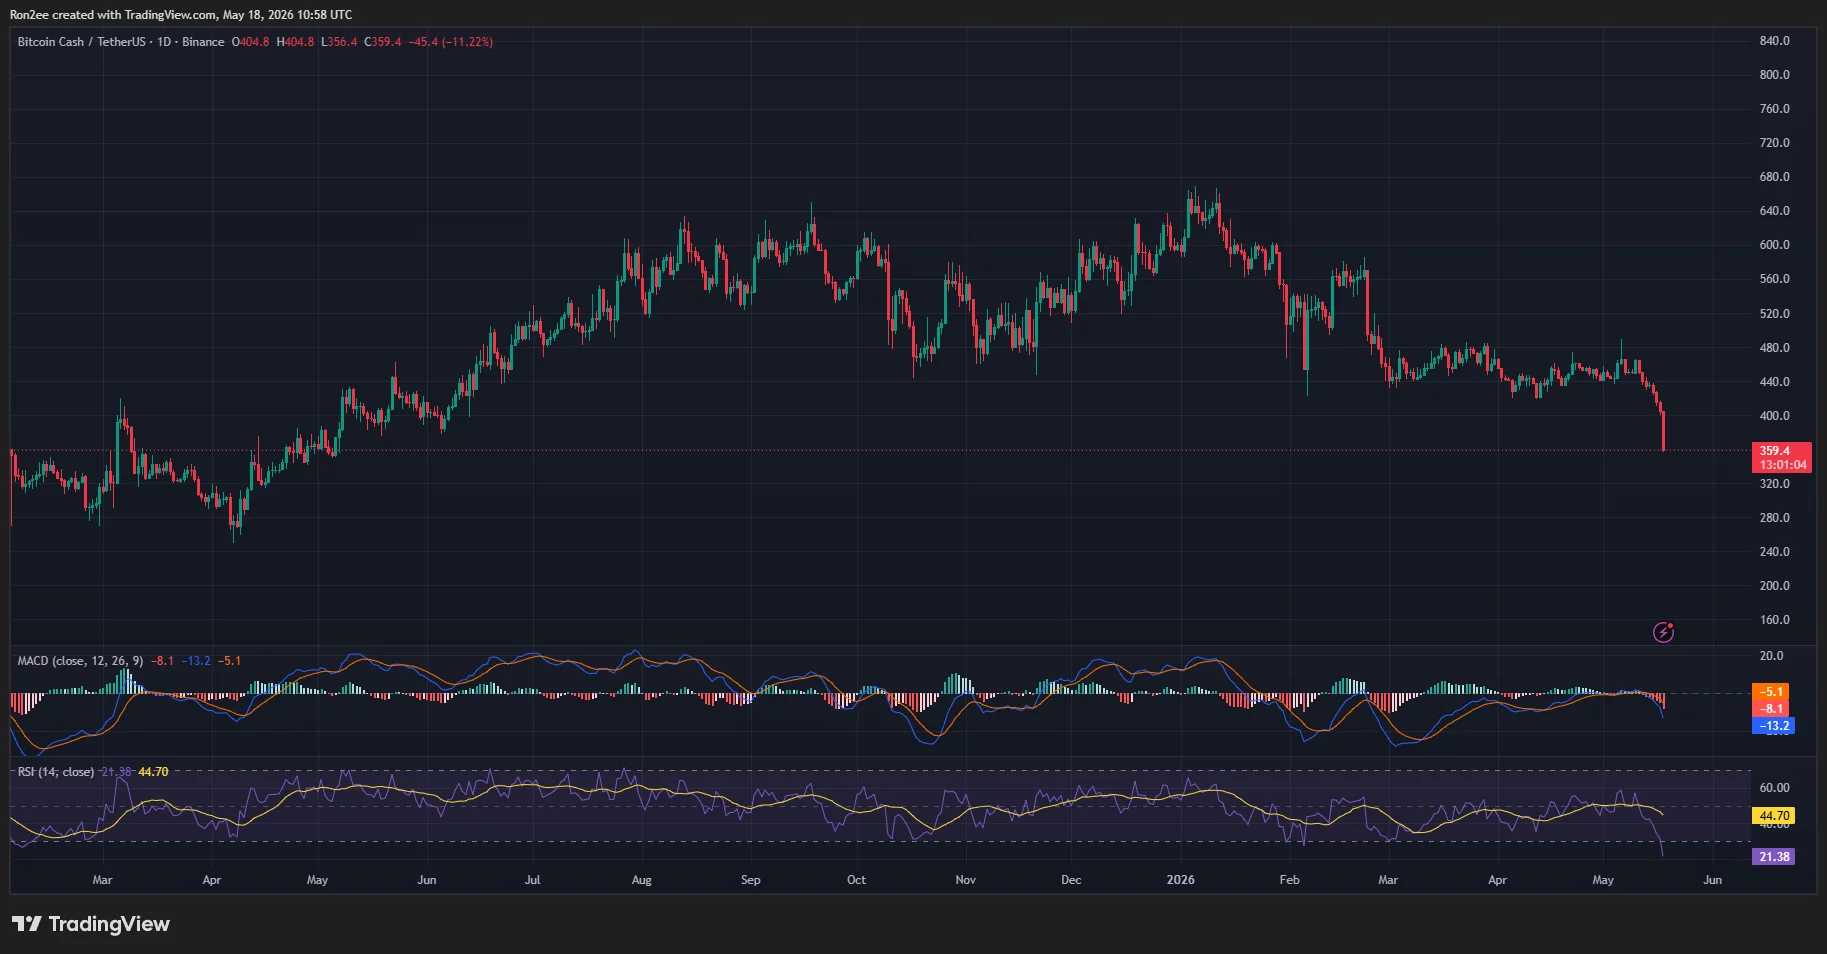
This breakdown further confirms the continuation of the broader bearish trend that remains established since BCH failed to reclaim the $640 resistance earlier this year.
Momentum indicators indicate that sellers continue to dominate. The MACD has confirmed another bearish crossover, and the histogram shows expanding negative momentum bars, typically indicating increasing downside pressure.
Meanwhile, the RSI has plunged into oversold territory near 21, demonstrating extremely weak short-term buying strength following the latest downturn. Although oversold RSI conditions might sometimes lead to temporary relief rallies, they also underscore the severity of the current bearish trend.
This recent breakdown heightens the risk for Bitcoin Cash to revisit its 2025 lows near the $320–$340 range if sellers persist in defending the broken $400 support as new resistance.
A further drop below this level could subject BCH to an even steeper correction towards the psychological $300 mark.
On the upside, bulls must first reclaim the $400 level to stabilize short-term momentum. A successful recovery above this territory may allow BCH to retest the next significant resistance area near $440, though overall momentum still heavily favors sellers.
Disclosure: This article does not constitute investment advice. The content and materials presented on this page are intended for educational purposes only.