

Bitcoin Price Declines as Daily MACD Signals Bearish Trend at $76K
Bitcoin is retreating from the upper limit of its ascending channel on Powell’s final FOMC day, with a daily MACD bearish crossover now officially confirmed and prices moving toward crucial SMA support. In this article, we analyze the signals from the daily chart, potential price trajectories, and the implications of the Fed’s transition to incoming Chair Kevin Warsh, which introduces new uncertainties.
Summary
- Bitcoin is priced at $75,834 on April 29, down 0.67% during the session, as a daily MACD bearish crossover indicates a shift in momentum.
- The price has retreated from the upper boundary of the ascending channel and is currently testing the SMA 20 at $75,685 for immediate support.
- If the SMA 20 fails to hold, the next support level is the SMA 50 at approximately $72,082; a confirmed close above $80,000 would negate the bearish outlook.
On April 29, Bitcoin (BTC) is trading at $75,834, down 0.67% for the day after hitting a peak of $77,904, with sellers regaining control ahead of the Federal Reserve’s rate decision. This pullback coincides with Jerome Powell’s final FOMC press conference before his term ends on May 15, and marks the first negative flip of the daily MACD histogram in several weeks, indicating that the momentum from April’s 21% recovery may be diminishing.
Daily MACD bearish crossover at descending channel resistance
The daily chart illustrates Bitcoin’s movement within two overlapping structures. The ascending channel originating from February lows around $59,000, characterized by two parallel blue trendlines, remains operational and has defined the entire recovery through April. Conversely, a wider descending channel formed by two red trendlines extending from the February highs near $85,000 is constraining the macro recovery, with the SMA 200 at $84,423 positioned within that upper boundary, acting as significant overhead resistance.
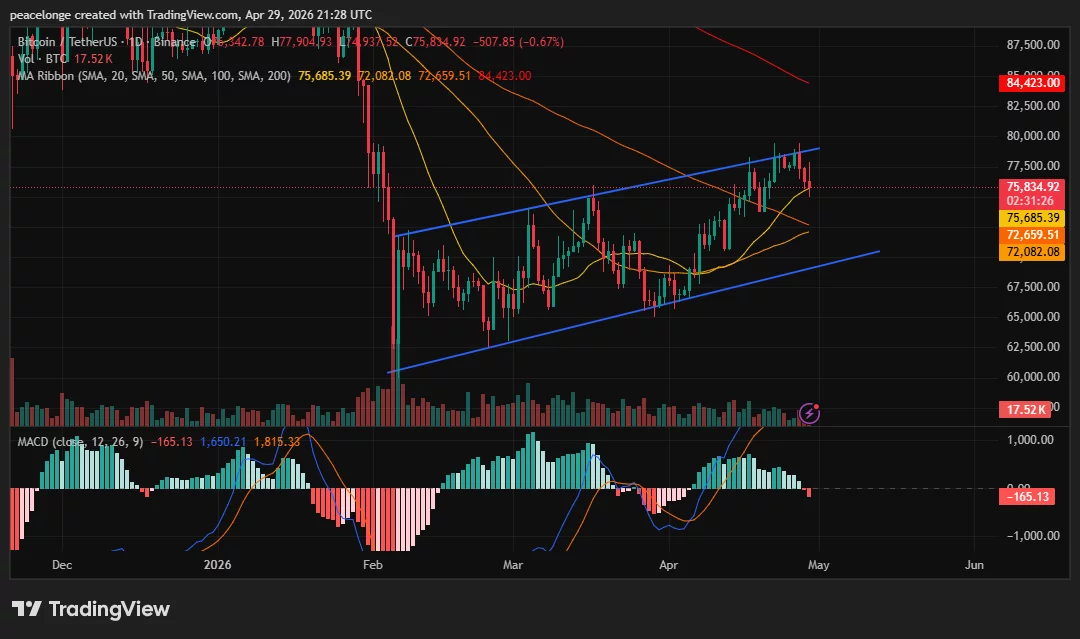
On April 28, price tested the upper area of the ascending channel near $78,000 before a noticeable pullback ensued, leading to the session’s high of $77,904 before dropping to $75,834 at the time of writing. A key technical development observed is related to the MACD. The MACD line is at 1,650.21, the signal line at 1,815.33, and the histogram at -165.13, confirming a bearish crossover on the daily timeframe. Crypto analyst Michael van de Poppe remarked on X that Bitcoin typically experiences pullbacks before and during FOMC events; however, he warned that a close below $73,000 would hint at a more profound correction rather than a standard reset.
Key levels: support, resistance, and price targets
The immediate support level is the SMA 20 at $75,685, which price is currently challenging. A daily close below this level would eliminate the first line of dynamic support and bring the SMA 50 at $72,082 and the SMA 100 at $72,659 into sharper focus. Both of these levels cluster tightly while analysts consider the $72,000 to $73,000 zone as the lower boundary of the ascending channel. A confirmed close below $72,000 would disrupt the ascending channel structure and lead to a reassessment of the $65,000 to $68,000 range, where significant on-chain accumulation occurred during the Iran-driven correction in Q1 2026.
On the upside, $80,000 remains the principal resistance and the bullish target that would invalidate the current bearish MACD reading. Should Bitcoin surpass this resistance, the SMA 200 at $84,423 and the upper limit of the descending red channel would become focal points that bulls need to clear for a confirmed structural trend reversal. A confirmed daily close above $80,000 with volume would revert the near-term bias back toward a neutral stance.
ETF flows and derivatives context
As reported by crypto.news, spot Bitcoin ETFs observed $89.68 million in net outflows on April 28, ending an eight-day inflow streak totaling $2.43 billion. Historical data shows that Bitcoin has declined in the wake of eight of the last nine FOMC meetings within 48 hours following the decisions, driven primarily by traders unwinding pre-event long positions rather than by the corresponding rate decisions. The current situation, with BTC entering the FOMC after a 21% rally in April and the Fear and Greed Index around 40, closely mirrors earlier setups that preceded significant post-meeting declines.
Powell’s exit and the Warsh uncertainty
This particular meeting adds an extra layer of uncertainty beyond the rate decision. Powell’s term concludes on May 15, with incoming Chair Kevin Warsh anticipated to oversee the FOMC meeting on June 16 to 17 as his first official engagement. As reported by crypto.news, institutional flows have shown sensitivity to changes in Fed communication tone throughout 2026, while rising oil prices near $105 per barrel intensify concerns regarding rate-cut expectations. Warsh’s hawkish profile relative to Powell might alter the June dot plot, potentially tightening the liquidity outlook for risk assets. Thus, the crucial period post-FOMC on April 30 and May 1 will be vital in determining whether this pullback stabilizes or extends toward $72,000.
If Bitcoin holds above the SMA 20 at $75,685 and reclaims $77,500 with a daily close, the ascending channel will remain viable, and the bearish MACD crossover may be just a transient signal. Conversely, a decline below $72,082 would confirm a deeper correction.